

A dashboard is a single screen that pulls numbers, statuses, and alerts from scattered systems into one view, so people can monitor what's happening, compare performance, and decide what to do next without opening a dozen records. That's the whole job. The charts, filters, and colors exist to serve it.
The surprise arrives after the screen loads. Most dashboards stop at showing you a problem. Far fewer tell you who owns it, which record proves it, and what should happen next. That gap is where missed deadlines and stalled decisions live, and it's closed by design choices, not by prettier charts.
What Dashboards Are Used For at a Glance
Start with the analogy that never fails. A car dashboard puts speed, fuel, engine temperature, and warning lights in front of the driver. Nobody hands you a service manual at 70 mph and asks you to compute your own fuel range. The panel summarizes the state of the machine so you can keep driving safely, and it hides the thousands of sensor readings that would make that impossible.
A business or legal dashboard does the same thing for a portfolio of work. It's a summary surface, not a filing cabinet.
The rule that separates a useful one from a busy one is boring: show what changes decisions, hide what doesn't. A fuel gauge earns its space. A readout of every sensor in the engine bay doesn't.
| Dashboard type | Typical data shown | Main use | Question it answers |
|---|---|---|---|
| Executive KPI | Revenue, growth, churn, margins | Monitor overall business health | Are we on track this quarter? |
| Project and task | Status, owners, due dates, blockers | Keep work moving and catch delays | Which tasks are overdue and who owns them? |
| Marketing and SEO | Traffic, rankings, conversions, spend | Track campaign and channel performance | Which channels bring in leads? |
| Finance | Cash flow, budgets, receivables | Control spending and liquidity | Can we cover next month's costs? |
| IT and operations | Uptime, incidents, ticket volume | Detect and resolve service problems | Which systems are degraded right now? |
| Legal matter | Deadlines, court events, tasks, workload | Monitor matters and prevent missed dates | Which filings and tasks are due this week? |
Six rows cover most of what teams build. The data changes, the mechanics don't. Someone opens the screen at 8 a.m., scans for anything red or aging, and decides where the next hour goes.
If the marketing row is the one you own, this breakdown of how to track law firm marketing performance shows how to connect channel spend to intake rather than to vanity traffic. Same principle, different data set.
Every row in that table answers one version of the same question. What needs my attention now? Get that wrong and the dashboard becomes wallpaper. Get it right and people open it before they open their email.
How Dashboards Organize and Summarize Information
The route from a raw system of record to a decision runs in one direction, and it's worth seeing the whole path before you choose a single chart.
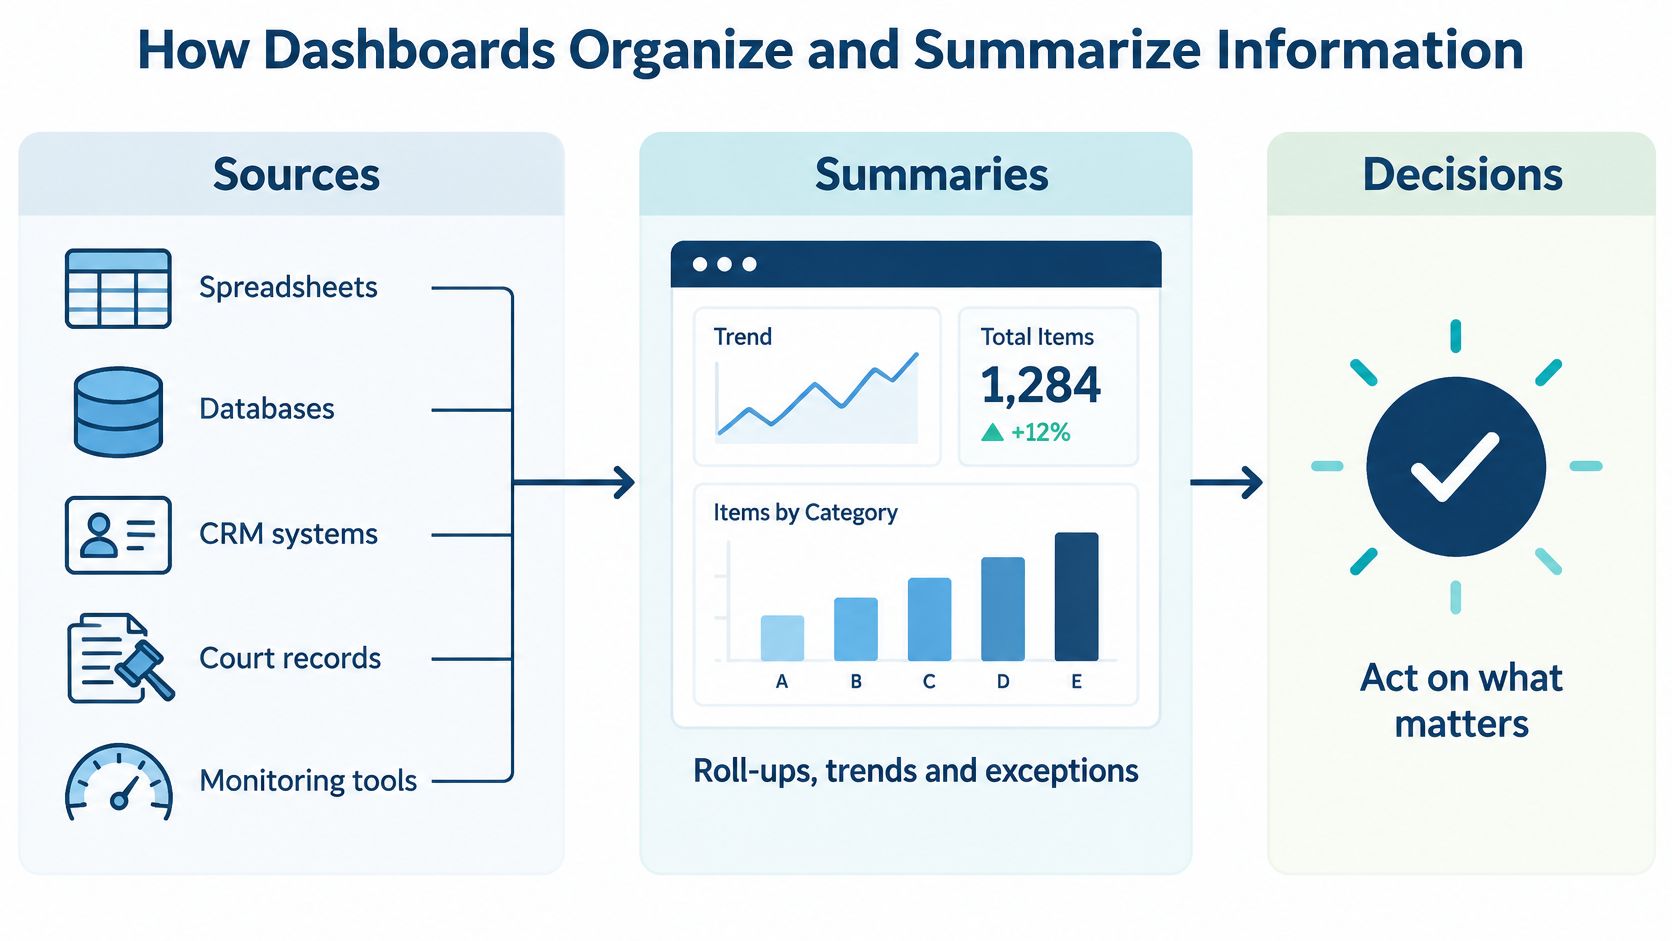
Three stages, in order.
Sources. Spreadsheets, databases, CRM systems, court records, and monitoring tools hold the raw facts. Each has its own login and its own idea of what a matter, a customer, or a ticket is called. The dashboard doesn't copy that data anywhere. It queries it.
Summaries. A bar compares categories. A line shows direction over time. A status color marks an exception. None of this is ornament. Each encoding replaces a small piece of mental arithmetic the reader would otherwise do by hand, across dozens of rows.
Interaction. Filters narrow the population. Drill-downs open a single record. View switches reframe the same data for a different question. This is the stage that separates a dashboard from a printed report, and it's the one teams often underbuild.
An airport departure board makes the sequence obvious. The board summarizes every flight, and the gate screen narrows to the one you need. You don't want the board to show every passenger's seat assignment, and you don't want the gate screen to show the whole airport.
A dashboard that can't take you from 400 matters down to the one that's late is a poster, not a tool.
The technical definition matches that behavior. Researchers behind the SIMBA dashboard benchmark describe dashboards as interactive decision-support interfaces that connect a user's analytical goals to underlying database queries. The benchmark tested that link across six real-world dashboard specifications and four database-management systems, generating sequences of filtering, drilling down, and view changes to see whether users could reach equivalent goal queries. Goal completion and interaction paths became the measures, not visual appeal.
If you're comparing the analytics layer that sits underneath this pipeline, this guide to AI analytics tools for SMEs covers how those tools handle summarization and drill paths in practice.
The standard the research sets is practical. Each interaction should shrink the query space until an actionable record appears on screen. If a filter can't do that, it's noise with a dropdown attached.
Why Dashboards Beat Raw Reports
A ranked screen beats a raw table when the decision is time-sensitive. In an experiment with 108 participants, dashboard users reached 61.9% decision accuracy against 48.0% for people reading the same information as tables, according to a systematic review of dashboard research.
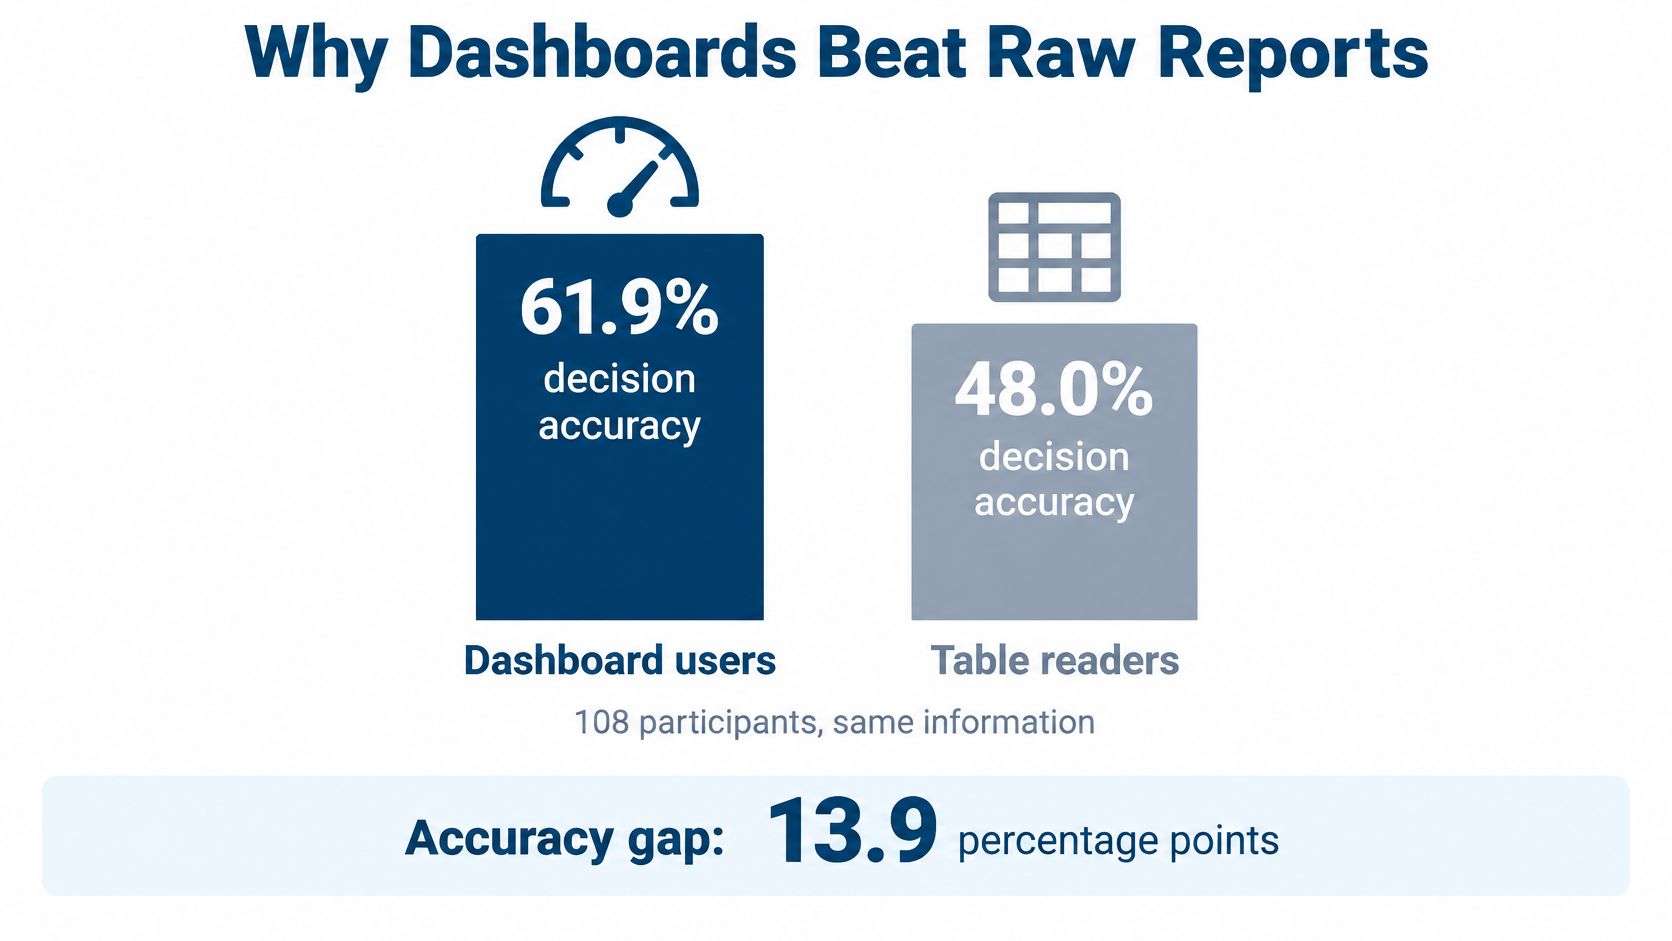
| Measure | Dashboard users | Table readers |
|---|---|---|
| Decision accuracy | 61.9% | 48.0% |
A raw report leaves the sorting to the reader. A dashboard ranks first, the way a kitchen rail puts the oldest ticket in front.
Effective dashboards externalize comparison and prioritization. A slipping deadline sits beside the person who owns it, and the row still points back to the matter record that produced the date. The reader reacts to a ranked exception instead of assembling the case from separate lists.
For a legal team, three design moves make that difference usable. Rank incomplete or escalating tasks by risk, not alphabetically. Show deadline status by matter and by responsible person, so the signal has an owner. Separate current, upcoming, and potentially missed events, because each one calls for a different next step: finish today's filing, prepare the one coming up, or escalate the one that may already be late.
Practical rule: if a user has to build the comparison in their head, the dashboard hasn't done its job yet.
A polished layout does not guarantee action. Many dashboards look finished and still leave the reader unsure who acts, which record the number came from, or what to open next. Data quality, audience fit, and a visible source record decide whether the accuracy gap in the table shows up in the office.
The screen does not choose the filing. It beats a spreadsheet when it ranks, compares, and points at one exception with an owner, a source matter, and a next action clear enough to take.
Real-World Dashboard Examples Across Teams
A dashboard earns a place in the meeting only after someone can name the next move.
A sales manager opens a pipeline view before the Monday forecast call. Deals that slipped a stage sit at the top, each with an owner and the opportunity record underneath. She chooses the first call from that short list. The screen already says whose name is on the deal.
A hospital command center keeps a wall board running with bed capacity and emergency wait times. The figure that matters is the one trending the wrong way, readable from across the room. Capacity is the source record. The charge nurse owns the next bed assignment. A trend with no owner does not free a bed.
A marketing lead compares channel spend against conversions and shifts next month's budget toward the channel that is producing leads. During an outage, an IT team watches uptime, ticket queues, and incident age so the on-call engineer can see which ticket is oldest and who is already assigned. For teams running live service desks, these incident and SRE dashboard metrics show what that compression looks like panel by panel. A legal operations manager scans matters by deadline pressure and workload before assigning the week, with the matter file as the source and a named attorney as the owner.
Same pattern in every room. The dashboard compresses a large population into a short list a person can influence. Each item carries an owner, a source record, and a next action.
Firms increasingly run part of this work in the cloud. Operations then has a dashboard job with nothing to do with billable hours: confirm that matters sit in approved systems and that access reviews are getting closed. Those signals stall if nobody is assigned to close them.
The viewer is rarely one person. A 2025 systematic review in Frontiers in Communication identifies accessibility and inclusivity as continuing problems for dashboards, including color or format mismatches, difficulty of use on mobile devices, cultural interpretation barriers, and the need to control data density. The same review notes that a short-term interface customization study made dashboard users faster and more accurate while lowering perceived cognitive load.
Which view works depends on the person, the context, and the permissions. A docketing clerk needs a compact exception queue: overdue dates, the matter they belong to, and the task to clear next. A managing partner needs aging and workload trends so a staffing decision has a record behind it. An IT administrator needs audit and access information, then a named reviewer who closes the exception. Same firm, three screens, one source of truth. If that split matters to your team, this overview of legal operations management covers how the roles divide the work.
How Legal Teams Use Matter Dashboards
A matter dashboard answers a question that a client list and a calendar can't answer together: what is the state of this case, and what's the state of the whole portfolio?
Per matter, it holds the client, jurisdiction, court events, tasks, key dates, documents, and timeline. Across the portfolio, it rolls up deadlines by week, workload by timekeeper, and overdue or escalated tasks. The value is proximity. A docketing clerk can see the deadline and the document and the responsible attorney in one place instead of three tabs.
Deadlines need calculation, not a calendar cell
This is the part that separates legal dashboards from every other kind. Federal deadlines follow mechanics that a plain date field can't reproduce. Federal Rule of Civil Procedure 6 is the federal example, and it's specific.
| Scenario | How the deadline is counted |
|---|---|
| Trigger day | Excluded from the count |
| Intermediate days | Every day counted, including Saturdays, Sundays, and legal holidays |
| Final day | Included in the count |
| Final day falls on a weekend or legal holiday | Moves to the end of the next day that is not a Saturday, Sunday, or legal holiday |
| Hour-based deadline | Counting starts immediately after the triggering event, and every hour counts, including weekends and holidays |
| Clerk's office inaccessible on the last day | Period extends to the first accessible day that is not a weekend or legal holiday |
A dashboard that encodes those rules can show a calculated due date and flag the assumptions behind it, such as whether the period runs in days or hours. A dashboard that only displays the date someone typed in can be confidently wrong.
A calendar cell tells you what someone believed on the day they entered it. A rule engine tells you what the court requires now.
Where docket monitoring fits
Docket feeds are a separate function from deadline math, and mixing them causes confusion. PACER supplies federal case records and docket activity. Its billing runs quarterly, and charges apply only above $30 for the previous quarter, with fees waived at or below that threshold. PACER's own fee page also states that 75 percent of users don't pay a fee in a given quarter.
A good matter dashboard keeps three things identifiable in one working view: a new docket entry, a calculated response deadline, and a retrieval cost. Otherwise a docket alert looks identical to a rule-driven deadline, and the person triaging it can't tell whether they need to read a document or verify a date.
Rule 6 is a federal illustration. State courts and individual case orders impose their own requirements, so any serious platform needs jurisdiction-specific rule sources and human review for unusual matters.
When a Dashboard Should Trigger Action
More metrics can make a dashboard harder to read, not easier. That's the contrarian finding worth sitting with, because most dashboard requests start with "can we add."
A 2025 usability study found that dashboard design factors could explain up to 99% of the variance in task-completion time for users working with interfaces that didn't accommodate low graph literacy. A systematic review cited alongside it warns that excessive visual elements can obscure the insight and that missing or poorly managed data can actively mislead. Both failures come from the same root: the screen was designed to display rather than to route work.
So set the bar higher than status. Every signal needs four things. An owner. An escalation rule. A source record. A next action. Miss one and the signal becomes a conversation instead of a task.
In legal work that plays out in predictable ways:
- An overdue task triggers reassignment, not a reminder. Someone else takes it, and the change reaches their calendar.
- A moved court date triggers calendar verification, because the downstream tasks built on the old date are now wrong.
- A new docket entry triggers document review by a named person, with the docket as the source record.
- An unexplained number triggers an investigation of the underlying matter record before anyone acts on it.
That last one matters more than it sounds. A TheyDo 2025 leadership report found that 77% of surveyed executives in the United Kingdom, United States, and Netherlands said they only sometimes or rarely question the data they relied on in dashboards. If three out of four leaders accept the number as given, then source notes and data-quality checks belong in the design, not in a wiki nobody opens.
If any of this should run without a human touching it, the wiring behind legal workflow automation is the piece that turns an alert into an assignment.
Three misconceptions are worth clearing up.
Dashboards don't decide. They present a ranked situation to a person who applies judgment. A screen that makes the judgment for you is a liability in any regulated field.
More charts don't mean more insight. Past a certain density, adding a panel subtracts from comprehension, which is exactly what the variance figure above measures.
A number without a source isn't a finding. It's a claim waiting to be challenged in a meeting where nobody can produce the record behind it.
Choosing a Matter Dashboard Your Team Will Use
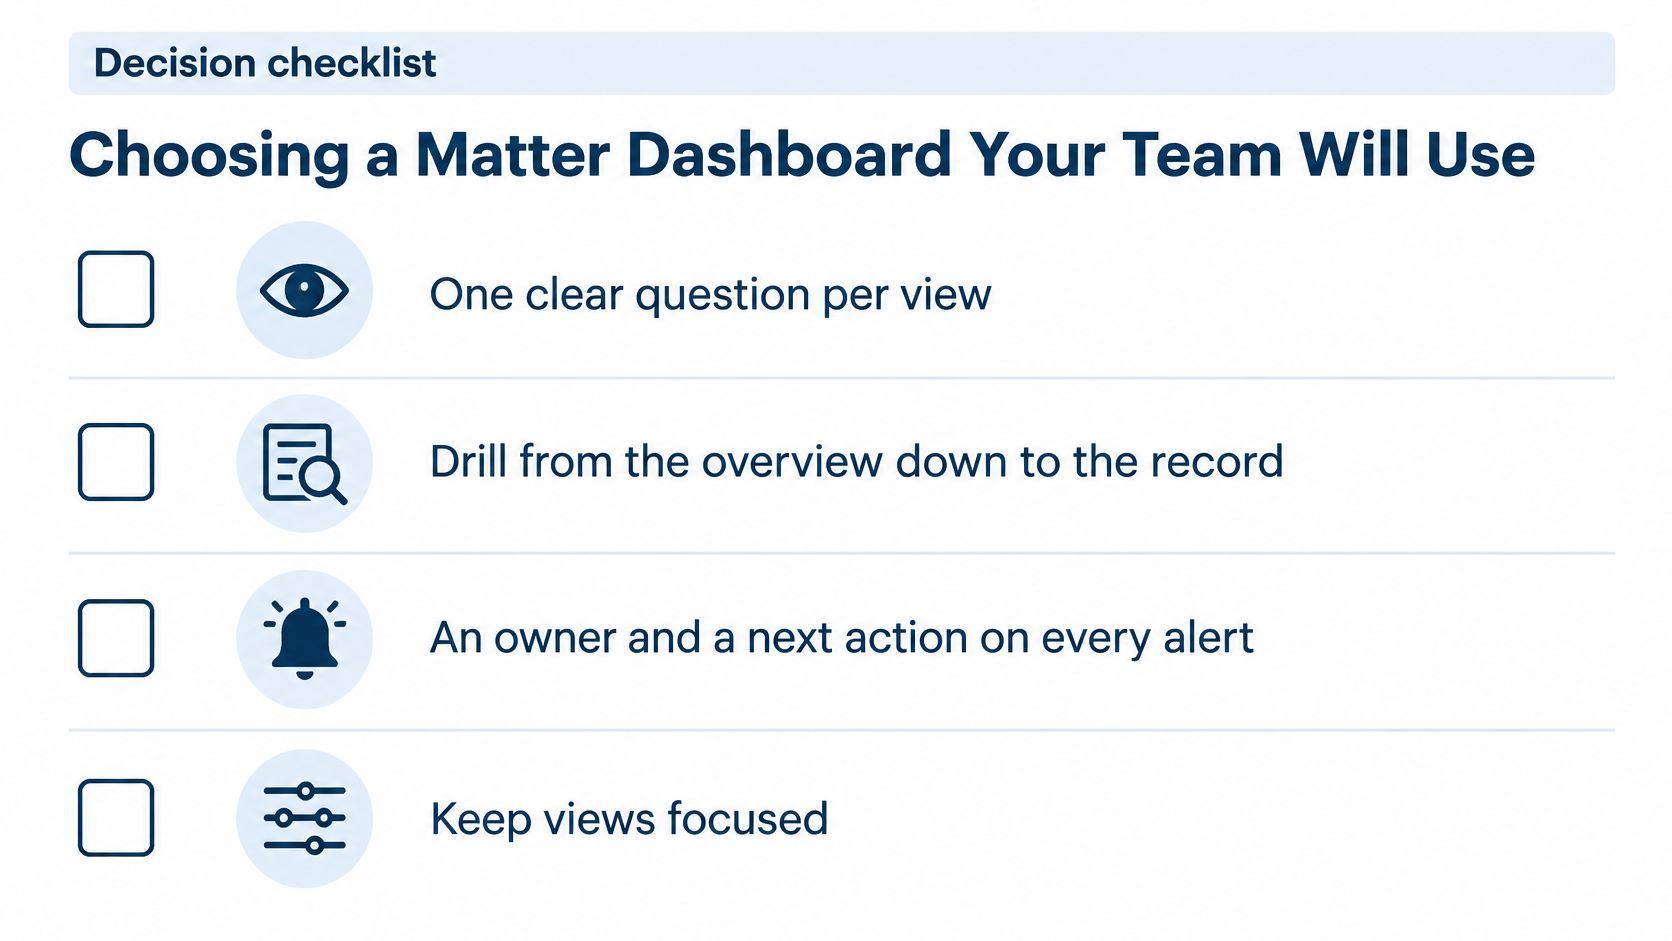
Skip the feature tour. Test the dashboard against the decisions your team makes, using four checks.
One clear question per view. If a panel answers two questions, it answers neither well.
Drill from the overview down to the record. Two clicks, not five. The overview should get you to the specific filing, task, or matter without a second search.
An owner and a next action on every alert. An alert with no assignee is a notification, and notifications get ignored by Thursday.
Views that fit the person and the device. Status shown by more than color alone. Density controlled for the viewer. Mobile access for anyone working from a courthouse hallway.
Then add the documentation test. For every number on the screen, someone on your team should be able to name the source system and the calculation behind it.
For legal work specifically, add five questions to the demo. Does the platform calculate deadlines from court rules rather than storing typed dates? Does it cover the jurisdictions you file in? Do changes sync to shared calendars? Are changes logged for audit? Does it enforce role-based access down to the document?
MatterAlert's Matter Dashboard is one worked example. It provides a centralized view of client information, jurisdiction, events, tasks, key dates, documents, and timelines, integrated with accounting and document management. Behind it, rule-based date calculations, calendar synchronization, notifications, task escalation, and event-level audit logs are aimed at reducing missed-deadline and malpractice risk. If you want the deeper checklist for evaluating platforms of this type, this guide to legal case management software covers the questions worth asking.
One honest limit: docket availability and rule coverage vary by court and jurisdiction, especially in Canada. Confirm the specific courts and rule sets you rely on during a demo rather than assuming they're included.
Your next step takes twenty minutes. Write down the three tracking questions that carry the most risk in your practice right now. Not the ones that sound impressive in a partner meeting, the ones that keep someone awake the week before a filing deadline. Then hold every dashboard you look at, including any demo, against those three questions and your own jurisdictions. A platform that can't answer them on the first pass probably won't answer them in month six either.
Dashboards earn their place when they shorten the distance between noticing a problem and assigning the fix. MatterAlert brings court-rule deadline calculation, docket monitoring, task escalation, and calendar synchronization into one matter-centered view, so a red date on the screen arrives with an owner and a next step attached. Visit MatterAlert to see how the Matter Dashboard handles your jurisdictions, and bring those three tracking questions to the demo.